
Blog

  • Sea of Blue (Tiles)

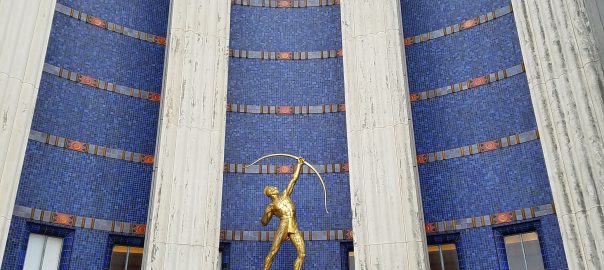
    The facade of the Hall of State at Dallas Fair Park is awash in small blue tiles. As such, it provides an excellent opportunity for a fun element of almost any math walk: A Really Big Number. In this case, how many tiles are there on the facade?

    To get a handle on this, we will take advantage of the fact that the tiles are in uniform horizontal rows. So we just need to estimate how many tiles in each row and how many rows there are in all, and then multiply.

    For the first estimate, notice that the facade is shaped like a giant cylinder standing on its circular base; or rather, it’s a semi-cylinder, with horizontal rows of tiles along the semicircular arc of its perimeter. Go and stand where you think the center of that semicircular arc is.

    The center of a semicircle is on its diameter, halfway between its endpoints where it meets the arc. So to find that position, you can count the flagstones horizontally between the two ends of the semicircular arc of the facade. There are 13 flagstones across, so the center is at the midpoint of the center (7th) flagstone.

    But what we really want is the perimeter of that semicircle. Dividing the usual formula defining pi by two, we get that the length of a semicircle is pi times the radius of the semicircle (since the radius is half of the diameter). Measuring the flagstones, you will find that they are 40 inches across by 43 inches deep (toward the building). But now don’t be fooled! Even though there are six and a half flagstones from the center to the wall of the building on the left and right, that’s not the radius of the semicircle formed by a row of blue tiles — there is a balcony above the doors to the building, and the blue wall of tiles is behind that balcony. So don’t just multiply 40 inches by 6.5 to get the radius.

    Instead, we will take the measurement from the center straight ahead to the inside doors of the building, which we can guess are directly below the blue wall of tiles (guessing that the compartment between the inner and outer doors on the ground level is the same depth as the balcony above, because architects like to line things up neatly). And that turns out to be six of the long dimensions of the flagstones, plus 38 inches for the last partial flagstone that lines things up with the building, plus eight feet to the inner doors, for a total of 6×43 + 38 + 96 = 392 inches.

    Multiplying by pi, each row of tiles is approximately 1,232 inches long. Next, we need to know how big each tile is. Most likely, they are squares a whole number of inches on a side. So to get an idea of how many inches, take a look at how many tiles tall those windows on the second level are: about 24 tiles tall. So are the windows most likely to be two feet, four feet, or six feet tall? Our experience tells us that a two-foot window would be quite short and a six-foot window would be unusually tall (especially for a building built in 1936), so we conclude the tiles are two inches by two inches.

    Therefore, dividing the perimeter of the semicircle by 2, there are approximately 616 tiles in one horizontal row. To count how many rows, note that the tiles are in seven groups vertically, and we can simply count that there are 30 rows of tiles in each group, for 210 rows in all. So, ignoring the tiles missing because of the windows, there are roughly 616×210 = 129,360 blue tiles on the front of the Hall of State!

  • Isosceles Esplanade

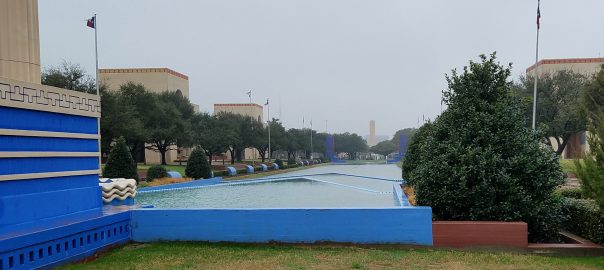
    Perhaps your stroll around Dallas Fair Park brings you to the Esplanade, a stately reflecting pool between Centennial Hall and the Automotive Building. The designers of the Esplanade for the 1936 World’s Fair had a difficulty, however: one end of the Esplanade is five to ten feet higher than the other, and of course water won’t stay with a slanted top; it always finds its level. So they had no choice but to install  some retaining walls (in this case, two) between one end of the Esplanade and the other, dividing the pool into three separate sections. Water flows over one of the retaining walls, creating a pleasant cascade.

    Rather than choosing to build the walls straight across the Esplanade, the designers chose to angle the walls, creating two long, sharp triangles pointing away from one end of the Esplanade and leading the eye toward the fountain in the lowest section of the pool. Looking at these triangles, it looks very likely that the two sides of each triangle are the same length, making them a special kind of triangle called an isosceles triangle.

    Looking at the resulting vista, one question that comes to mind is whether the engineers made the two triangles the same shape or not. The first thing to notice is that they can’t literally be identical shapes, because as you can see in the picture above, the nearer triangle is inset horizontally (along the shorter dimension of the pool) from the farther triangle. In other words, the base of the nearer triangle is shorter than the base of the farther triangle.

    But when we talk about things being the “same shape,” we don’t usually mean that they are identical. For example, in the usual sense, all squares are the same shape, but there are certainly different sizes of squares.

    Instead, what we usually mean when we say two things are the same shape is that you could scale one up to the size of the other and then the shapes would be identical. (The specific math word used for this is that the shapes are similar.) How can we tell if the two isosceles triangles in the Esplanade are similar?

    A little geometry tells us that two isosceles triangles are similar if their vertex angles (in this case, the “pointy ends”) are equal. So if we had a giant protractor and could set it down on those two points, we could figure it out. But unfortunately, we don’t have a giant protractor, and those two points are stuck in the middle of the pool; there’s no way to get to them without taking a swim (and breaking Fair Park rules)!

    To take a different approach, if those angles are equal, then the sides of the lower triangle will be parallel to the corresponding sides of the upper triangle. And in the photo above they do look parallel. So can we be sure? It looks pretty good even from another view:

    However, to be really sure, we should go back to the very definition of “similar:” every dimension of the two shapes should be in the same proportion. To check this, we should pace out the “horizontal” (along the short side of the pool) and “vertical” (along the long side of the pool) dimensions of each of the two walls. If you take equal-sized steps, you can just count your steps along the edges of the pond from when you are opposite one end of the wall until you are opposite the other. To get the short dimension, where the far, pointy end of the triangles are blocked from view by the tower on the left of the pictures, remember that those points of the triangles are lined up with the center line of the pool (and don’t forget that the farther wall extends farther to the left and right of the tower than then near wall — make sure you’re lined up correctly when you are pacing them off).

    When you have the two counts for each of the walls, divide the “vertical” count by the “horizontal” and see if you get the same quotient; that’s the definitive test of similarity. Give it a try!

  • The Big Wheel

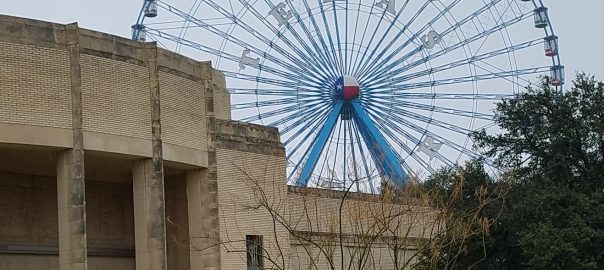
    It’s hard to escape noticing the Texas Star Ferris Wheel towering over the landscape at the Dallas Fair park: Texas Star Ferris WheelAfter all, it’s the largest Ferris wheel in the United States.

    As you’re watching it turn, there are lots of things you might wonder about, but if you’re like me, one of the first that comes to mind is: How fast is your gondola whisking through the air when you ride it?

    To answer this question, we will go back to the venerable equation:

    rate = distance / time

    for which we will need to obtain a distance traveled and the time it takes to travel that distance. The obvious time to use is the time for one full revolution of the wheel. If the Texas Star is turning when you visit, then you can grab a stopwatch, choose one of the gondolas, start your timer just as it brushes the ground at the bottom of the wheel, follow it around with your eyes, and stop the time when it returns to the same location. If the wheel is still, you-ll have to rely on information found elsewhere on the web or on my timing — about 40 seconds for a full revolution.

    How far does the gondola go in one revolution? Well, what path is it traveling along? It’s a circle, the characteristic shape of a Ferris wheel. So we need the perimeter of that circle, also known as its circumference, for which we can use another famous equation:

    Circumference = π × diameter.

    How to find the diameter of the wheel? If you can get up close to the Texas Star, you can start all the way at one side where the farthest-out bit of the wheel is just above your head, and count your paces (try to take equal-sized steps) walking alongside the wheel until the opposite side of the wheel is just above your head. Then with a measuring tape measure the length of ten of your paces (again, trying to use that same equal-sized step you used when pacing off the wheel). Divide the number of paces you counted by ten (hint: that’s easy to do by moving the decimal point one position to the left) and multiply by the length of ten paces.

    If you can’t get close enough to the wheel for this method, then again you can rely on published information. According to a 2007 New York Times article, the diameter is approximately 212 feet.

    Plugging in to the equation, the gondola travels about 666 feet in one revolution. So using the rate equation, that’s roughly 666/40 = 16.65 feet per second.

    OK, that’s nice, but how fast is that? To get a better handle on the speed, we’d like to convert it into a more familiar unit, like miles per hour. To do that, we need to use some unit conversions, which we should write like fractions so that we can cancel:

    (16.65 feet / second) x (1 mile/5280 feet) x (3600 seconds/hour)  = 11.35…miles/hour

    So the moral of this story is that when you’re riding the Texas Star, you’re traveling at just over 11 miles per hour — not quite as fast as you can ride your bike. On the other hand, it’s pretty hard to ride your bike 20 stories high into the air!

  • Southern Methodist University Math Walk

    On 2017 April 19, in collaboration with talkSTEM, I designed and led a math tour of the campus of Southern Methodist University. The set of posts just completed prior to this one describe all of the different places we stopped and mathematical ideas and phenomena we observed and discussed. We hope that these glimpses of a college campus from a mathematical point of view will enrich your experience of SMU campus, or serve as inspiration as you look at other places that you visit with a mathematical eye.

  • Bishop Boulevard

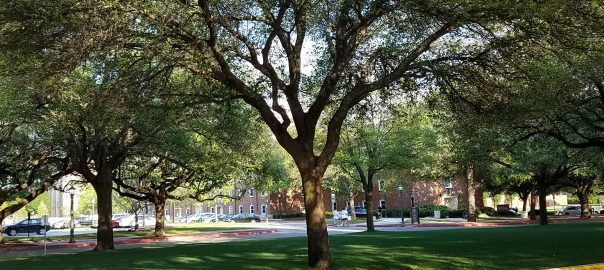
    As you’re taking a stroll down Bishop Boulevard on the campus of Southern Methodist University, stop a moment to enjoy the stately trees that line the avenue. There are many different aspects of trees that one can look at from a mathematical persepctive, but we’re going to take a look at how the tree branches, from a point of view similar to the one we used at the Centennial Fountain. One can easily see that there are more and more branches as you progress from the trunk toward the leaves, but why do they become thinner and thinner? You could say that it’s for structural reasons, but you could certainly design a stable structure that did not become thinner at the extremities, like a coatrack. On the other hand, if we think about what’s going on inside those branches, we can get more of a handle on how they become smaller. Namely, the tree’s sap needs to carry nutrients back and forth between the roots and the leaves. So if we think of the branches as a sort of plumbing system that connects the two, which says that the fluid carrying capacity of the trunk should roughly match the total fluid carrying capacity of all of the branches at any level of the tree. This has led researchers to formulate a rough principle that the total cross-sectional area of all of the branches crossing any cross-section of the entire tree should be the same no matter where that cross section is taken. Many real trees come close to fitting this intuitive model, which allows you to quantitatively understand why and to what degree the branches become thinner as you move toward the leaves of the tree.

  • Habito Labyrinth

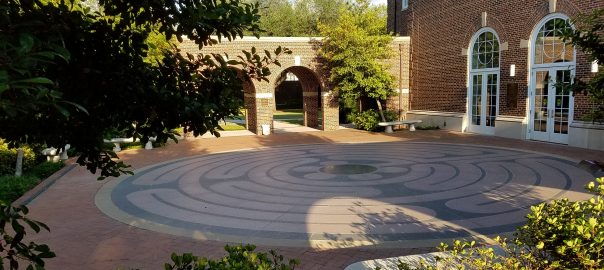
    Nestled in a courtyard of the Divinity School at Southern Methodist University, you will find the Habito Labyrinth. Labyrinths are actually in themselves a subject of study and interest to professional mathematicians, but before we get into that, let’s first ask whether a labyrinth is a maze. That’s of course a matter of terminology, but the key aspect of the passageways that are typically called “labyrinths” is that there are no choices at any point, only a single route that wends its way from the entrance to the center (or exit, depending on the labyrinth). Also typically that path reaches every point within the area comprised by the labyrinth. So there is never any difficulty or strategy in finding your way.

    The puzzle, therefore, becomes how to construct a labyrinth — how can you make a pathway that’s guaranteed to reach every point without running into a dead — and how to count how many different labyrinths there are. Those are the places where the mathematics come in.

    The study and enjoyment of labyrinths has an extremely ancient history. In fact, here’s a method for constructing a labyrinth hints of which have been found on clay tablets over three thousand years old. Begin with this figure, consisting of a large plus sign, four “L” shapes in the “elbows” of the plus sign, and four dots at the corners. The next step is to connect the bottom center point (the end of the bottom branch of the plus sign) to the point immediately to its right (one end of the bottom right “L” shape), like so. Next you connect the point immediately to the left of the ones you just used (one end of the bottom left “L”) to the point immediately to the right of the ones you just used (the bottom right corner point), like so. Now continue in this fashion, always connecting the next unused point to the left around the perimeter of the original diagram to the next unused point to the right, until all of the points have been used and your diagram looks something like this. Now you can trace your way through your labyrinth. There’s an entrance at the top, just to the left of center, and the passages are between the lines you’ve just drawn. You should be able to trace your finger (or other convenient pointer) all the way to the center (where you drew your first arc) without ever retracing your path, and visiting every point enclosed by the outermost arc.

    Attached you will find a sheet and directions that will allow you to explore making many more different labyrinths, and you can find lots more information about labyrinths and the mathematics of labyrinths on Prof. Tony Phillips’ website.

    LabyrinthDiagram     LabyrinthDirections


  • Calatrava “Wave”

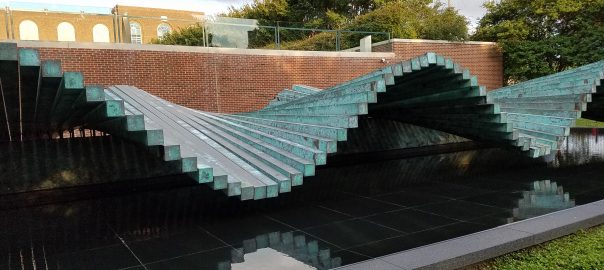
    Another three quickies, this time about the iconic sculpture “Wave” by Santiago Calatrava. (1) Is this sculpture curved or straight? (2) Is it symmetric? (3) How did Calatrava get each one of the copper beams to stay at the particular angle it sits at?

    Again, it’s best to give participants time to chew on these questions and generate their thoughts. Then you can bring everyone together to see if there’s consensus. Here are my thoughts. (1) This sculpture is both curved and straight! It’s a remarkable fact that there are truly curved surfaces that can be broken up completely into a collection of individual straight lines. Such surfaces are called ruled surfaces, and they have been the subject of much mathematical study. This “wave” surface is one, and others include the elliptical hyperboloid and hyperbolic paraboloid shown below.


    It is also very interesting that when a curved surface like this can be constructed from straight lines, it also has other straight lines that cross one such set of lines. That can be seen in Wave, as highlighted in the image below.(2) The question of the symmetry of the sculpture is a tantalizing one, becuase there is not a mirror symmetry along the central red line in the in the above picture (since a hump that is high on the left is low on the right and vice versa) nor is there a rotational symmetry around a vertical axis.  But, since each individual line runs through the central red line, there is a 180-degree rotational symmetry about that axis, which brings every one of the beams back to coincide with itself.

    (3) The secret to the different slopes of the different copper beams lies under the sculpture just to the left of the triangular support seen in the image above. If you peer under there, you will see a strut attaching to each beam, which otherwise can pivot at the central red line. Each of those struts is at a different height, and that height sets the slope of the corresponding beam. So as you peer under there, you will see the wave pattern of the entire sculpture replicated in those struts. In fact, there’s a mechanism inside the sculpture which allows each of those struts to move up and down, animating the entire sculpture.

  • Ford Stadium

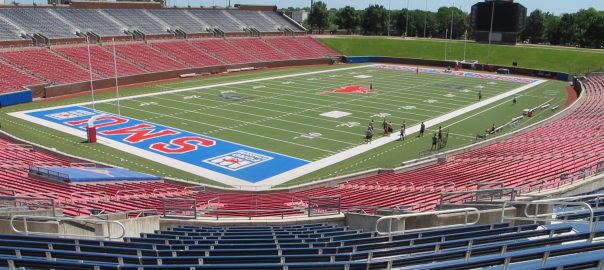
    During the math tour I gave on the campus of Southern Methodist University, I was given the challenge of estimating the seating capacity of the Ford Stadium, never having seen it before and without any prior information about the stadium. To recap the techniques that I used, I first broke down the seating sections into two types: the “side” sections and the “corner” sections. I modeled the side sections as perfect rectangles, counting the number of rows and the number of seats in each row and multiplying to get the total number of seats in the section. I was greatly helped in counting the seats in each row by small numbers imprinted across some of the benches to indicate the individual seats. I modeled the “corner” sections as trapezoids of seats, averaging the estimated number of seats in the bottommost and topmost rows and multiplying by that same number of rows. I then counted the number of side sections and multiplied by the seats in each section, and counted the number of corner sections and multiplied by the number of seats in each of those sections, and added everything up. In the end, my estimates were well within five percent of the true value, which was a lot of fun for estimating such a large number. See if your participants can also come close!

  • Hillcrest Amphitheater

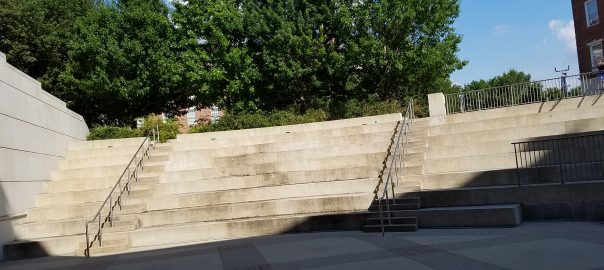
    Here are three quick questions concerning the Hillcrest Amphitheater in the Lyle School of Engineering on the campus of Southern Methodist University. First, if you laid a plank of wood on top of the seats, and another plank on top of the steps, and a third on top of the hand rails, which would have the greatest slope? Second, what fraction of a circle does the the amphitheater take up? Third, what point in the amphitheater is equidistant from the entire first row of seats?

    These questions should work well to spark geometric conversations among tour participants. Try to allow them time to come to their own answers. When the group discussions have completed, come together and see if you agree with the following conclusions:

    On the first, all of the planks will have the same slope. The railing is parallel to the steps because it is always the same height above the steps (all of the support posts are the same height), and parallel lines have the same slope. Also, from the picture we can see that each step is one-third the height of each of the seats, and if you measure, you will find that each one is also one-third the depth. Therefore the slope, which is the rise (or the height) divided by the run (or depth) is the same for the steps as the seats.

    On the second, we can see (although not in the above picture) that the amphitheater is tucked between two adjacent walls of the building it is attached to. Since building walls are generally placed at right angles, we conclude that the amphitheater is a quarter circle.

    On the third, how do we even know there is a point equidistant from all of the seats in the first row? Well, each row is a circular arc, and that’s exactly what a circle is, the set of points equidistant from a single point, the center of the circle. So we need to find the center of the amphitheater circle. For that, we can use the principle that the center of a circle is the intersection of any two radii. Harkening back to the previous question, notice that the two walls of the building defining the two boundaries of the amphitheater are necessarily radii of the amphitheater. So armed with the map below, we can see that the point we’re looking for is actually inside the building — not as good a place to address a crowd at Hillcrest Amphitheater about the wonders of math as we might have hoped!

  • Cooper Centennial Fountain

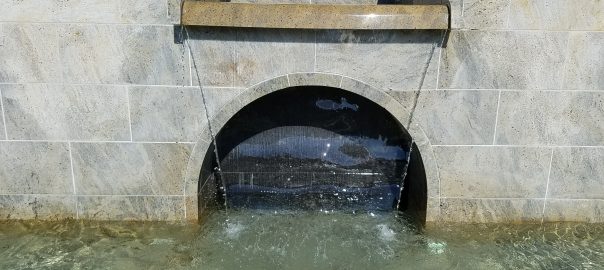
    Here’s a picture of one of the spouts of the Cooper Centennial Fountain in the Turner Quad on SMU campus. Do you notice anything of interest about the way the water falls? One thing that many people notice is that the water flows in toward the center on either side of the stream. Why would that be? The water is flowing straight ahead in the channel above the spout; why wouldn’t it continue to fall straight ahead, producing vertical sides to the sheet of falling water?

    Actually, just a few simple mathematical principles will show why the stream is compelled to become more narrow as it falls. Consider the amount of water that flows, say in one second, across any horizontal line in the image, say the bottom lip of the marble spout or one of the mortar lines in the wall behind the stream. That amount of water is proportional to the width of the stream times the speed at which the water is falling. On the other hand, the only source for water flowing across a line closer to the ground is the water crossing a line higher up; no new water is coming into existence within the stream. So the amount of water per second crossing any two horizontal lines must be the same (assuming water is being released over the lip at a steady rate, which it presumably is).

    Now here’s the key point: water, like anything else falling under the influence of Earth’s gravity, speeds up as it falls. So if the stream did stay a constant width as it fell, the amount of water crossing lower horizontal lines in a unit of time would be greater than the amount of water crossing higher horizontal lines. Since that’s impossible, the stream must become narrower as it falls. Mathematics forces it to.

    Now, you might ask, “Doesn’t this have something to do with surface tension or cohesion forces in the water?” And that’s a very reasonable question. There is in fact another logical alternative to the stream becoming narrower: the sides of the stream could remain vertical, but it could break up internally into numerous smaller substreams, perhaps eventually forming a mist. It’s surface tension and/or cohesion of the water that keeps it together in a single stream, and given that it remains a single stream, the simple math above tells us that stream must become narrower. (Even if the stream did break up, the “total width” in some sense of all of the substreams would of necessity decrease as the water fell, for exactly the same reason.)

    In fact, because matter is neither created or destroyed in the fountain, the math tells us more: the amount of narrowing must precisely offset the speedup of the water. Hence, a great activity that participants with a high school math background could do is actually model the contour of the sides of the stream. If you measure the speed of the water going over the lip, you can (using the effects of constant acceleration due to gravity), derive the speed of the water at any position below the lip, which in turn allows you derive the width of the stream at any height. Assuming (because of symmetry) that the stream remains centered below the lip of the spout, you can then derive an equation for the side contour of the fountain. Participants could graph their equations, and then superimpose their graphs over images of the fountain (or even the actual fountain, if the graphs are made in a waterproof medium). You should be able to achieve excellent agreement between the model and the actual contour of the water in this system. If you create any such images, please add a comment to this post telling us about it.