On 2017 April 19, in collaboration with talkSTEM, I designed and led a math tour of the campus of Southern Methodist University. The set of posts just completed prior to this one describe all of the different places we stopped and mathematical ideas and phenomena we observed and discussed. We hope that these glimpses of a college campus from a mathematical point of view will enrich your experience of SMU campus, or serve as inspiration as you look at other places that you visit with a mathematical eye.
Category: Southern Methodist University
Math walk stops from a math tour of Southern Methodist University in Dallas, Texas.
-
Bishop Boulevard
As you’re taking a stroll down Bishop Boulevard on the campus of Southern Methodist University, stop a moment to enjoy the stately trees that line the avenue.
 There are many different aspects of trees that one can look at from a mathematical persepctive, but we’re going to take a look at how the tree branches, from a point of view similar to the one we used at the Centennial Fountain. One can easily see that there are more and more branches as you progress from the trunk toward the leaves, but why do they become thinner and thinner? You could say that it’s for structural reasons, but you could certainly design a stable structure that did not become thinner at the extremities, like a coatrack. On the other hand, if we think about what’s going on inside those branches, we can get more of a handle on how they become smaller. Namely, the tree’s sap needs to carry nutrients back and forth between the roots and the leaves. So if we think of the branches as a sort of plumbing system that connects the two, which says that the fluid carrying capacity of the trunk should roughly match the total fluid carrying capacity of all of the branches at any level of the tree. This has led researchers to formulate a rough principle that the total cross-sectional area of all of the branches crossing any cross-section of the entire tree should be the same no matter where that cross section is taken. Many real trees come close to fitting this intuitive model, which allows you to quantitatively understand why and to what degree the branches become thinner as you move toward the leaves of the tree.
-
Habito Labyrinth
Nestled in a courtyard of the Divinity School at Southern Methodist University, you will find the Habito Labyrinth.
 Labyrinths are actually in themselves a subject of study and interest to professional mathematicians, but before we get into that, let’s first ask whether a labyrinth is a maze. That’s of course a matter of terminology, but the key aspect of the passageways that are typically called “labyrinths” is that there are no choices at any point, only a single route that wends its way from the entrance to the center (or exit, depending on the labyrinth). Also typically that path reaches every point within the area comprised by the labyrinth. So there is never any difficulty or strategy in finding your way.
The puzzle, therefore, becomes how to construct a labyrinth — how can you make a pathway that’s guaranteed to reach every point without running into a dead — and how to count how many different labyrinths there are. Those are the places where the mathematics come in.
The study and enjoyment of labyrinths has an extremely ancient history. In fact, here’s a method for constructing a labyrinth hints of which have been found on clay tablets over three thousand years old. Begin with this figure, consisting of a large plus sign, four “L” shapes in the “elbows” of the plus sign, and four dots at the corners.
 The next step is to connect the bottom center point (the end of the bottom branch of the plus sign) to the point immediately to its right (one end of the bottom right “L” shape), like so.
 Next you connect the point immediately to the left of the ones you just used (one end of the bottom left “L”) to the point immediately to the right of the ones you just used (the bottom right corner point), like so.
 Now continue in this fashion, always connecting the next unused point to the left around the perimeter of the original diagram to the next unused point to the right, until all of the points have been used and your diagram looks something like this.
 Now you can trace your way through your labyrinth. There’s an entrance at the top, just to the left of center, and the passages are between the lines you’ve just drawn. You should be able to trace your finger (or other convenient pointer) all the way to the center (where you drew your first arc) without ever retracing your path, and visiting every point enclosed by the outermost arc.
Attached you will find a sheet and directions that will allow you to explore making many more different labyrinths, and you can find lots more information about labyrinths and the mathematics of labyrinths on Prof. Tony Phillips’ website.
LabyrinthDiagram LabyrinthDirections
-
Calatrava “Wave”
Another three quickies, this time about the iconic sculpture “Wave” by Santiago Calatrava.
 (1) Is this sculpture curved or straight? (2) Is it symmetric? (3) How did Calatrava get each one of the copper beams to stay at the particular angle it sits at?
Again, it’s best to give participants time to chew on these questions and generate their thoughts. Then you can bring everyone together to see if there’s consensus. Here are my thoughts. (1) This sculpture is both curved and straight! It’s a remarkable fact that there are truly curved surfaces that can be broken up completely into a collection of individual straight lines. Such surfaces are called ruled surfaces, and they have been the subject of much mathematical study. This “wave” surface is one, and others include the elliptical hyperboloid and hyperbolic paraboloid shown below.


It is also very interesting that when a curved surface like this can be constructed from straight lines, it also has other straight lines that cross one such set of lines. That can be seen in Wave, as highlighted in the image below.
 (2) The question of the symmetry of the sculpture is a tantalizing one, becuase there is not a mirror symmetry along the central red line in the in the above picture (since a hump that is high on the left is low on the right and vice versa) nor is there a rotational symmetry around a vertical axis. But, since each individual line runs through the central red line, there is a 180-degree rotational symmetry about that axis, which brings every one of the beams back to coincide with itself.
(3) The secret to the different slopes of the different copper beams lies under the sculpture just to the left of the triangular support seen in the image above. If you peer under there, you will see a strut attaching to each beam, which otherwise can pivot at the central red line. Each of those struts is at a different height, and that height sets the slope of the corresponding beam. So as you peer under there, you will see the wave pattern of the entire sculpture replicated in those struts. In fact, there’s a mechanism inside the sculpture which allows each of those struts to move up and down, animating the entire sculpture.
-
Ford Stadium
During the math tour I gave on the campus of Southern Methodist University, I was given the challenge of estimating the seating capacity of the Ford Stadium, never having seen it before and without any prior information about the stadium.
 To recap the techniques that I used, I first broke down the seating sections into two types: the “side” sections and the “corner” sections. I modeled the side sections as perfect rectangles, counting the number of rows and the number of seats in each row and multiplying to get the total number of seats in the section. I was greatly helped in counting the seats in each row by small numbers imprinted across some of the benches to indicate the individual seats. I modeled the “corner” sections as trapezoids of seats, averaging the estimated number of seats in the bottommost and topmost rows and multiplying by that same number of rows. I then counted the number of side sections and multiplied by the seats in each section, and counted the number of corner sections and multiplied by the number of seats in each of those sections, and added everything up. In the end, my estimates were well within five percent of the true value, which was a lot of fun for estimating such a large number. See if your participants can also come close!
-
Hillcrest Amphitheater
Here are three quick questions concerning the Hillcrest Amphitheater in the Lyle School of Engineering on the campus of Southern Methodist University.
 First, if you laid a plank of wood on top of the seats, and another plank on top of the steps, and a third on top of the hand rails, which would have the greatest slope? Second, what fraction of a circle does the the amphitheater take up? Third, what point in the amphitheater is equidistant from the entire first row of seats?
These questions should work well to spark geometric conversations among tour participants. Try to allow them time to come to their own answers. When the group discussions have completed, come together and see if you agree with the following conclusions:
On the first, all of the planks will have the same slope. The railing is parallel to the steps because it is always the same height above the steps (all of the support posts are the same height), and parallel lines have the same slope. Also, from the picture we can see that each step is one-third the height of each of the seats, and if you measure, you will find that each one is also one-third the depth. Therefore the slope, which is the rise (or the height) divided by the run (or depth) is the same for the steps as the seats.
On the second, we can see (although not in the above picture) that the amphitheater is tucked between two adjacent walls of the building it is attached to. Since building walls are generally placed at right angles, we conclude that the amphitheater is a quarter circle.
On the third, how do we even know there is a point equidistant from all of the seats in the first row? Well, each row is a circular arc, and that’s exactly what a circle is, the set of points equidistant from a single point, the center of the circle. So we need to find the center of the amphitheater circle. For that, we can use the principle that the center of a circle is the intersection of any two radii. Harkening back to the previous question, notice that the two walls of the building defining the two boundaries of the amphitheater are necessarily radii of the amphitheater. So armed with the map below, we can see that the point we’re looking for is actually inside the building — not as good a place to address a crowd at Hillcrest Amphitheater about the wonders of math as we might have hoped!

-
Cooper Centennial Fountain
Here’s a picture of one of the spouts of the Cooper Centennial Fountain in the Turner Quad on SMU campus. Do you notice anything of interest about the way the water falls?
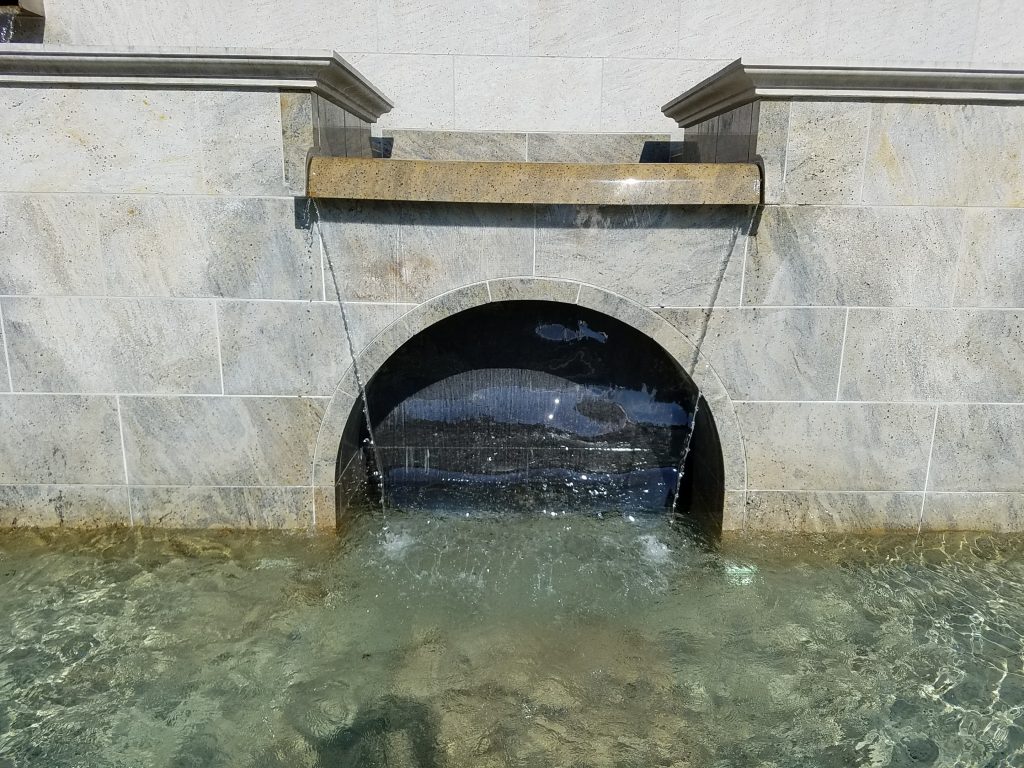 One thing that many people notice is that the water flows in toward the center on either side of the stream. Why would that be? The water is flowing straight ahead in the channel above the spout; why wouldn’t it continue to fall straight ahead, producing vertical sides to the sheet of falling water?
Actually, just a few simple mathematical principles will show why the stream is compelled to become more narrow as it falls. Consider the amount of water that flows, say in one second, across any horizontal line in the image, say the bottom lip of the marble spout or one of the mortar lines in the wall behind the stream. That amount of water is proportional to the width of the stream times the speed at which the water is falling. On the other hand, the only source for water flowing across a line closer to the ground is the water crossing a line higher up; no new water is coming into existence within the stream. So the amount of water per second crossing any two horizontal lines must be the same (assuming water is being released over the lip at a steady rate, which it presumably is).
Now here’s the key point: water, like anything else falling under the influence of Earth’s gravity, speeds up as it falls. So if the stream did stay a constant width as it fell, the amount of water crossing lower horizontal lines in a unit of time would be greater than the amount of water crossing higher horizontal lines. Since that’s impossible, the stream must become narrower as it falls. Mathematics forces it to.
Now, you might ask, “Doesn’t this have something to do with surface tension or cohesion forces in the water?” And that’s a very reasonable question. There is in fact another logical alternative to the stream becoming narrower: the sides of the stream could remain vertical, but it could break up internally into numerous smaller substreams, perhaps eventually forming a mist. It’s surface tension and/or cohesion of the water that keeps it together in a single stream, and given that it remains a single stream, the simple math above tells us that stream must become narrower. (Even if the stream did break up, the “total width” in some sense of all of the substreams would of necessity decrease as the water fell, for exactly the same reason.)
In fact, because matter is neither created or destroyed in the fountain, the math tells us more: the amount of narrowing must precisely offset the speedup of the water. Hence, a great activity that participants with a high school math background could do is actually model the contour of the sides of the stream. If you measure the speed of the water going over the lip, you can (using the effects of constant acceleration due to gravity), derive the speed of the water at any position below the lip, which in turn allows you derive the width of the stream at any height. Assuming (because of symmetry) that the stream remains centered below the lip of the spout, you can then derive an equation for the side contour of the fountain. Participants could graph their equations, and then superimpose their graphs over images of the fountain (or even the actual fountain, if the graphs are made in a waterproof medium). You should be able to achieve excellent agreement between the model and the actual contour of the water in this system. If you create any such images, please add a comment to this post telling us about it.
-
Class of 1916 Sundial
Directly in front of Dallas Hall is the Class of 1916 Sundial. But over the years it has developed a problem: there’s nothing on it to cast a shadow!
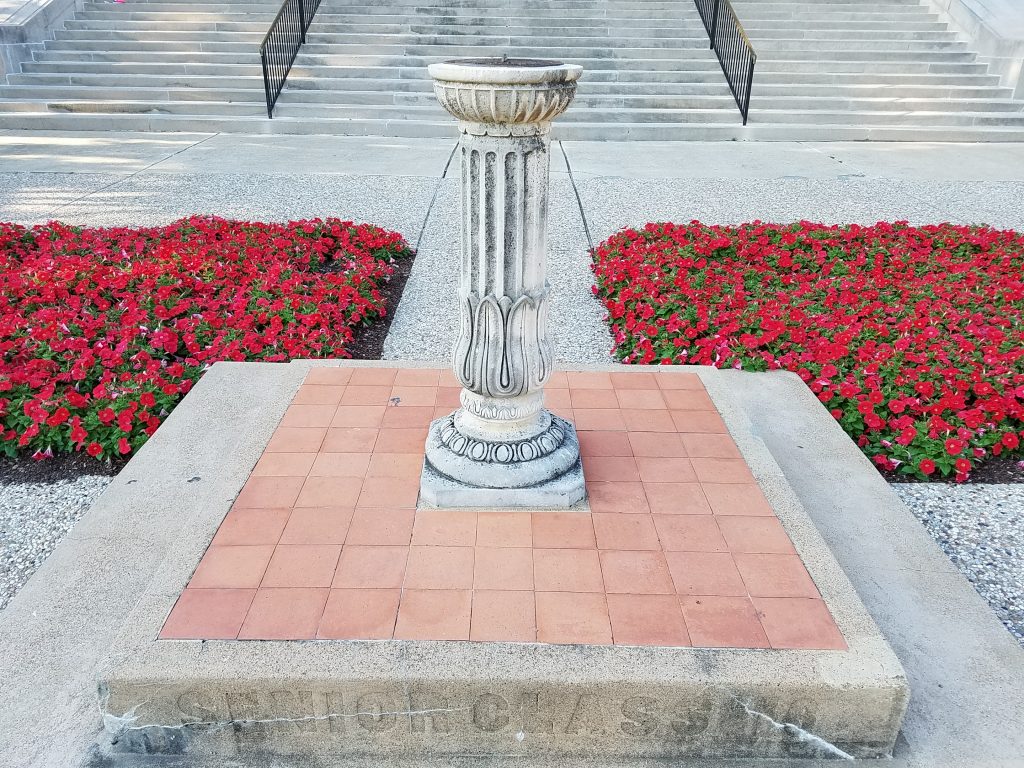 The piece that’s missing is called the style — a thin rod whose shadow lines up with one of the hour markings on the face of the sundial. Fortunately, you can use any relatively thin, straight object, like a pen from your pocket, as a substitute style, as long as you put it in the correct place. If you look at the top of the sundial, it’s pretty clear where the style was attached (the center of the disk), but how do we know what angle we should hold the pen at? Clearly it will cast a shadow in a different place depending on the angle.
Answering this question just requires a little bit of information about how a sundial works, and a little bit of geometry. The easiest sundial to imagine is one sitting exactly at the North Pole with its style pointing straight along the axis of the Earth’s rotation and its face flat on the ground (well, or icecap). Over the scale of one day, the Sun is pretty close to fixed in space relative to the Earth, so as the Earth rotates, the shadow of the style falls successively on different points on the face of the sundial, allowing us to tell the time. (In fact, during the summer at the North Pole, you can use such a sundial 24 hours a day. And what’s more, because the Earth rotates counterclockwise when viewed from the North Pole, the shadow will appear to move clockwise on the face of the sundial, which is where the “clockwise” direction came from in the first place!) This diagram should make things a little clearer:
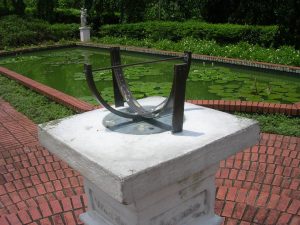
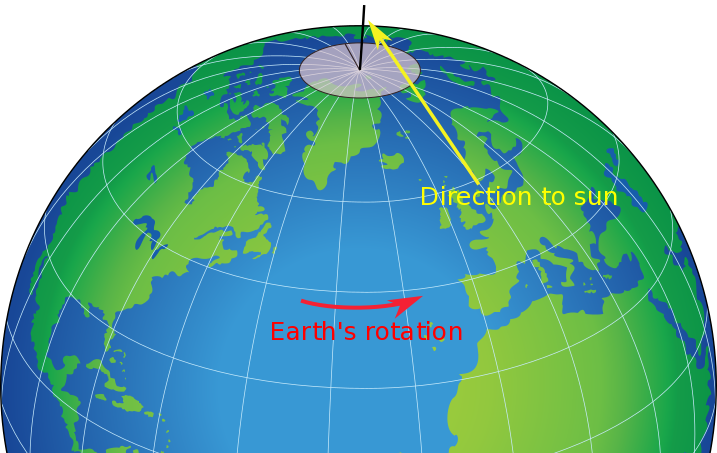 If you now imagine moving that sundial anywhere else on the globe (Dallas, say), it will work the same way as long as that shadow-casting rod, the style, remains pointing in the same direction in space (parallel to the Earth’s rotational axis). That means the style will not be perpendicular to the ground at any other location (except for the South Pole), although it will always point due North. For example, at the Equator, the style would be exactly parallel to the ground (and the shadow would move horizontally across the dial, which would have to be mounted below the style so that the style actually casts a shadow). That would look something like the below, which is in a garden in Singapore, a city that lies very nearly on the Equator.
 What about between the Equator and the North Pole? What angle should the style make with the ground? This diagram of a cross section of the Earth should help make that clearer.
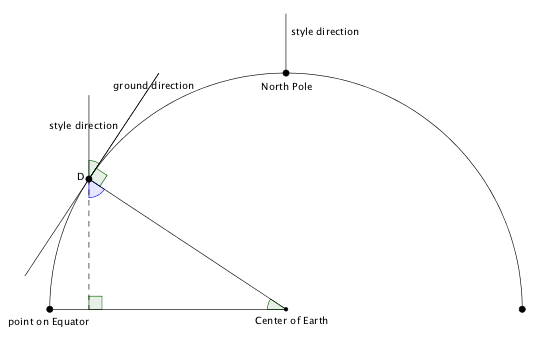 Because the ground direction is perpendicular to an imaginary line to the center of the Earth, the angle between the style and the ground at D is complementary to the angle shown in blue. But because the triangle shown with the dotted line is a right triangle, the angle in blue is also complementary to the angle that D makes with the Equator at the center of the Earth. So since they’re complementary to the same angle, the style angle is equal to the angle that D makes with the Equator. But that angle has a familiar name that makes it easy to look up: it’s called the latitude at the point D. So if D is Dallas, then we can look up the latitude as (approximately) 33°, and then lets us know to angle our pen-as-style at 33 degrees to the ground to read off the time. Oh, and don’t forget: the Sun doesn’t go on daylight savings time, so if that’s in effect, subtract an hour from the indicated time.
-
Dallas Hall Dome
The dome of Dallas Hall at Southern Methodist University is one of the most beautiful, striking, and symmetric structures on the entire campus.
 The entire structure has 16-fold rotational symmetry: if you stand at the center of the rotunda, look up at the dome, and then turn one-sixteenth of a full rotation, you will get exactly the same view of the dome. Not only is it beautiful (demonstrating, I think, an innate reaction to high symmetry), the structure of the dome allows you to count the elements in the decorations easily, because it sets up a linear relationship between the number of items in one section of the design and the number in the entire dome. So for example, to figure out how many brown scrolls there are around the entire domain, you count that there are seven in a single section, and then multiply by 16 to figure out that there are 112 scrolls in all. Or you can count the number of small carved rosettes near the edge of the design in one section, and multiply that number by 16 to get the total number of rosettes that had to be carved to decorate this dome.
If you look more closely, you will see that each one of the sections of the dome is composed of two mirror-symmetric halves. So there are really 32 copies of the same design adorning this dome, half in one orientation, and half as the mirror image. Overall, this is a remarkable illustration of structure and beauty of a highly symmetric design.
-
Blanton Student Services Building Exterior
The front of the Blanton Student Services Building poses a geometric puzzle.
 Or rather, the columns do: are the sides of the columns vertically straight, or do the columns become narrower as they go up? Of course, they appear narrower toward the top, but everything looks smaller the farther away it is. So how can we tell whether it’s just appearances or the columns are actually narrowing?
(As an aside, you might wonder why columns would be built narrower toward the top? As you can read in this article, people have been building columns this way for milllennia, but it remains a bit of a mystery as to why.)
In any case, with a bit of measuring, geometry, and careful photography, we can settle the issue for these particular columns. The first thing to notice is that the columns are centered in the large stone blocks at the top of the building, and the edges of those blocks line up with the pairs of lights in the roof over the porch, and those lights in turn line up with the center lines of the windows. So to get the separation of the columns (center to center) we can just measure the horizontal distance at the ground between the center lines of two adjacent windows.
Next, you can measure the diameter of the columns at the ground relatively easily, either by wrapping a cord around them once , measuring the cord, and dividing by pi, or by using straightedges (like yardsticks) to carry extreme points of one of the columns forward to the edges of the pedestal and measuring the distance between them. (If you do it this way, be careful to keep your straightedges parallel.)
You will discover that the diameter of the columns at the ground is a little over one-third of the separation between the columns, which is equal to the width of the large stone blocks at the top. Now, a careful blowup of a section of the above photograph (which was carefully taken from directly in front of one edge of a column) will show whether at the top of the column the column is wider than the space to its left to the edge of the block, which it would have to be if it remains larger than one third of the width of the block. Let’s see:
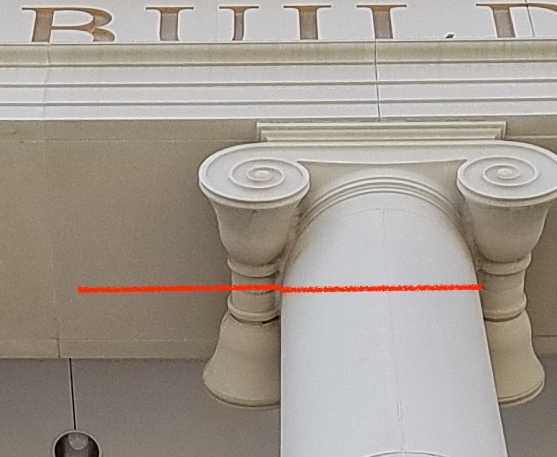 The two red strokes added to the photo are both the same length, so you can plainly see that at the top, the width of the column is less than one third of the width of the stone block. Hence, the architect of these columns decided to use the classical technique of having them become narrower toward the top, rather than giving the columns straight vertical sides. Mystery solved!
As a follow-up activity, you can have participants guess how tall the columns are, and then measure them by measuring the bottommost vertical section, and multiplying by the number of vertical sections.
You now actually have enough information to calculate the weight of each of the columns. Use the volume formula in terms of radius and height for a cylinder (even though we figured out they are not precisely cylinders, you’ll still be close; in fact, you’ll be exact if you use the average radius between the top and bottom of the columns). Then look up the density of concrete, multiply, and convert units. I ended up with each column weighing very roughly 25 tons or about the weight of a dozen cars.


